A look behind my FLL scoreboard
It’s the fourth year in a row that I develop a web scoreboard for the FLL RobotGame competition.
It’s starting to get routine, but each year has hat its lot of changes. I could have taken the same code base each year and simply update some variable, tweak logos and fix the calculation, but it evolved a bit more than that.
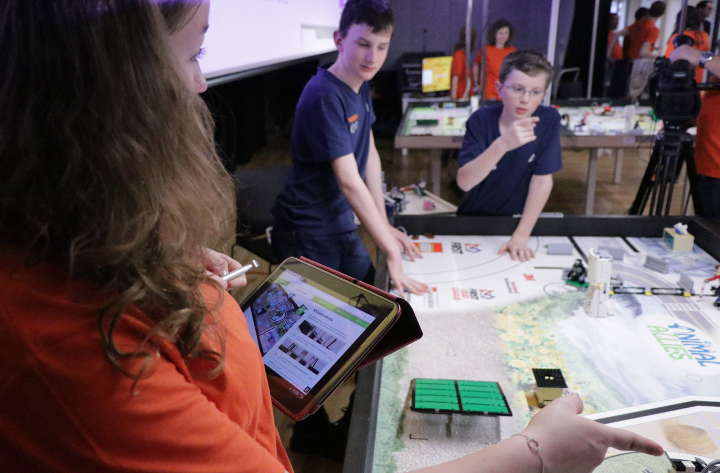
First, what is it ? The Robot Game is one of four challenges of FIRST LEGO League competition. Two teams compete on a mat with LEGO robots. Robots have 2min30 to score a maximum of points in different missions on the mat, in complete autonomy. Each year a new mat is released with missions around the season theme.
These missions are described in the challenge rules, and calculating your total of points is sometimes complicated, and often a bit ambiguous.
It’s never been clear to me if there is or isn’t an official scoreboard. The FLL has a platform to manage the competition that seems to handle score calculation, but it’s not publicly accessible. They also release the paper forms used by judges during the tournaments, but you have to calculate scores by hand !
That’s why in 2014 I created my first FLL scoreboard, and did so the following years as well.
Oh, and I should mention I’m a coach and “IT guy” in the Robots-JU robotics association, which is why I’m dealing with this competition. We also organized our own competition, as you will see below and probably read in future posts as well.
Let’s go back in history and explore the different iterations of my scoreboard.
2014
If I remember correctly it’s the first year I joined as a coach, and also the time where we officially founded the association. I participated in the FLL the previous two years as a member, but I was now too old to take part. So I joined as a coach and took care to setup our website and such.
I also decided to create a scoreboard. I knew from experience it would be really useful during the training, even if it was far from perfect. 2014 had a some very complicated rules where you had to calculate fractions of points for some missions to get the final result, making it very hard to do by hand.
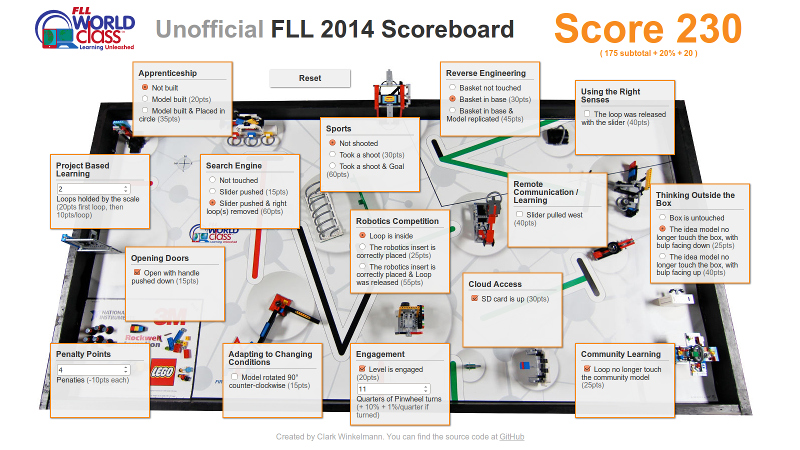
The 2014 scoreboard was a simple vanilla javascript application, with most of the calculation and texts hard-coded in the page. The page also featured a print stylesheet, which was never really used, and a sharable url, which also wasn’t particularly useful to my knowledge, given it was mostly used internally.
Right from the start I decided to publish the scoreboards on our website for everyone to use, and also published the source code under the MIT license on GitHub
2015
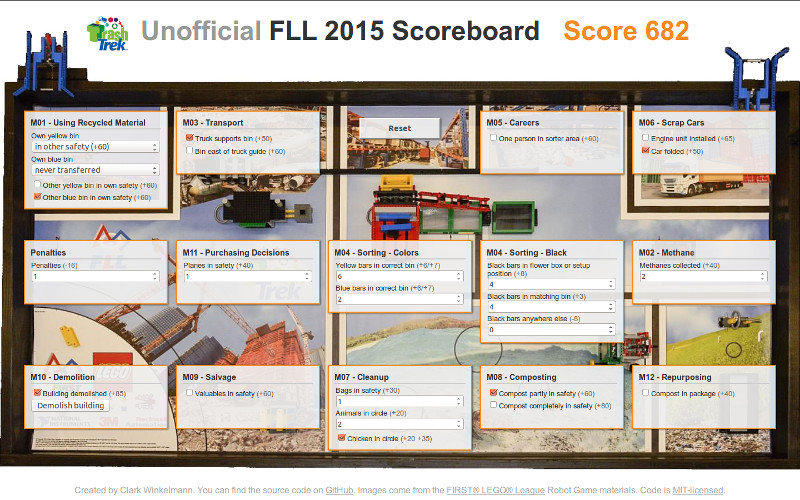
The 2015 scoreboard re-used the 2014 style, but everything else was rewritten.
I dropped the print stylesheet and also removed the shareable url feature.
Since 2014 I started using React and thought it was a perfect fit for the job, with plenty of inputs to sync and a single state management logic.
A regular complaint about the previous scoreboard was that it only contained English mission descriptions (We’re in the French part of Switzerland). So this year I added both French and English variations.
A big issue with the 2014 scoreboard was its fixed width. It was highly impractical on mobile devices. The 2015 version partly fixes it by aligning missions more regularly on the screen and allowing them to resize as the screen gets smaller.
Another big issue with the 2014 scoreboard was its unreliability. It contained no unit tests, and each fix was threatening the whole calculator.
To solve this, I extracted the calculator part of the scoreboard into a separate package, which would include a complete test suite checking every single mission based on the official rules.
At the start of 2016 we organized our first robotics competition, the Coupe Robots-JU. The competition re-use the Robot Game mat and rules of the FLL so teams who prepared for the FLL can easily take part in our competition as well.
During a typical FLL tournament, the Robot Game is divided into 3 rounds, in with each team plays once again another team. Matches usually start on alternate table every 5 minutes. The large breaks between rounds usually get overflowed by the matches schedule falling behind, and a lot of time seems to be lost calculating the ranks (thought it improved in the last years, probably because it’s now done on the platform I mentioned above).
During our Coupe, we pushed the concept further by making each team play multiple times per round, with a match starting every 5 minute and nearly no break. At the same time, the rankings were shown live on screen. This was made possible by judges using the scoreboard to quickly validate and send scores.
Integrating the web scoreboard into the scoring application wasn’t too difficult, given the ease to re-use React components.
The biggest issue we noticed was that it was hard to make sure you covered every single mission in the scoreboard before sending it. It’s also an issue we noticed when we wanted to quickly check we entered the correct data in the scoreboard just by looking at the mat.
It was useless to make changes to the scoreboard at that time, given the FLL season ended and the Coupe was a one-time event. It would be improved the next year.
2016
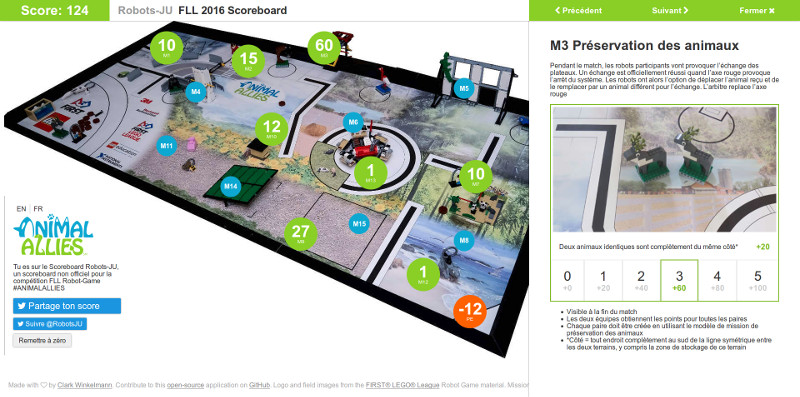
The 2016 scoreboard aimed to solve the remaining issues.
At the association we used the scoreboard on PCs, but it was clear that anybody from outside or simply on the go would prefer to use the app on a mobile device. The 2015 resizable layout was simply making things smaller on small screens. It was time to introduce a mobile-first layout.
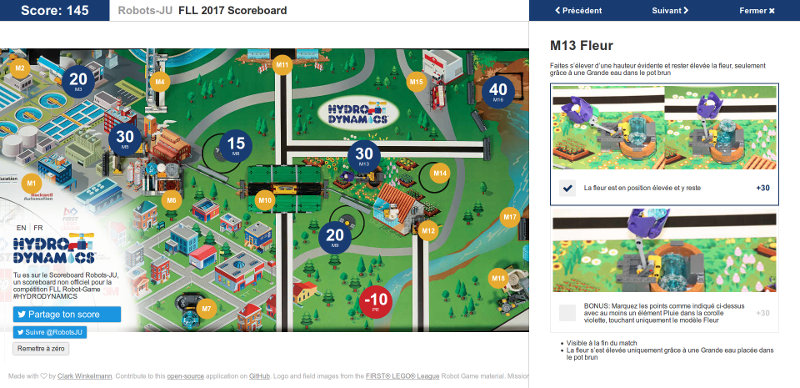
The interface was rewritten to just show small badges on the mat, and let the user browse mission details in a separate, paginated panel. The new layout also made place for longer mission descriptions and mission pictures.
The new interface also solved the coverage issue encountered the last year. By adding a paginated list of missions, it was now a lot easier to review all missions in order and not miss one. It was still possible to directly click on a mission on the mat to access it, just like before.
Social buttons to share the score on Twitter and connect with our association were added, but it looks like there were as much used as the print layout of the 2014 version.
Once again we organized the Coupe Robots-JU and used the scoreboard as part of the technology stack involved. The new layout proved a lot more efficient. Recording the scores and getting the team validation was now one of the shortest part of the organization (we’ve not managed to automate setting the mat back in start position yet !). We even managed to finish matches ahead of schedule at the end of the day !
A big advantage of using that scoreboard to calculate the scores is that you not only store the final score, but also the details of accomplished missions. This is useful for statistics and providing a complete detailed list of the results for each team and match. I suspect the official FLL platform also keeps track of the individual missions, but these are not shown in the interface.
2017
And here we are. This year challenge rules were released on the 28th of August, and I decided to try to break my personal (and maybe worldwide ?) record of time taken to publish an unofficial scoreboard.
It usually took me a few months before starting the work on the scoreboard so I don’t have to rewrite everything in case of a rule change. But this year the rules looked pretty straightforward so I started right away. In less than 12 hours the 2017 scoreboard was online.
Never finished coding the season scoreboard so quickly. Less than 12 hours since challenge release #FLL #HYDRODYNAMICS https://t.co/cFffxWQ4tl
— Clark Winkelmann (@clarkwinkelmann) 30 août 2017
I could probably have done it even faster, but I took the opportunity to make a few changes.
Since 2015 I went from React to Mithril as my main framework, and it already caused a few integration issues during the last Coupe to integrate the React scoreboard into the Mithril app. The React code of 2016 was also a big mess because everything was fit into a single file, meaning it required some major rewrite anyway.
I decided to re-create the exact same logic from React in Mithril. This went without issues, given the large similarities between the frameworks. The CSS style stayed mostly the same, with updated colors to reflect this year’s theme.
I also switched from a custom Gulp file to a Laravel Mix setup, which basically did the same things with nearly no code, better performance and better out of the box optimizations for the production files. I also dumped Bower completely and now use Yarn to install all dependencies. This removes a lot of complexity.
The most time-consuming tasks are copying texts from official websites and PDFs into the test suite and the scoreboard missions list. Since 2016 the layout is built from a JSON file, which allows for easy changes to the list of missions.
You can use the scoreboard on the Robots-JU website at https://fll-scoreboard-2017.robots-ju.ch/ and also check out the scoreboard source and the unit-tested score calculator source.
Future
In 2018 we will organize the third Coupe Robots-JU, which will most likely rely on the 2017 scoreboard. With the improvements of the past years, it has now become a robust part of our scoring stack.
As long as I will be an FLL coach and FIRST does not release an official and better tool I will probably keep coding new scoreboards. And I’m certainly not finished switching javascript frameworks either…
Given its early release it’s highly probable the 2017 scoreboard still has issues to address. Feel free to drop by the issues section on GitHub to report problems, make suggestions or directly contribute code.
If your team uses the scoreboard, we would be happy to hear about it. Please tweet us comments or pictures at @RobotsJU !
Written with StackEdit.